IC Markets Home Sign in Web Trader Contact Us
IC Markets Social IC Markets Social

Information Hub for
Serious Traders

  • ABOUT US
  • OPEN LIVE ACCOUNT
  • OPEN DEMO ACCOUNT
  • TRADE NOW
  • VISIT OUR BLOG
IC Markets Social
  • ABOUT US
  • OPEN LIVE ACCOUNT
  • OPEN DEMO ACCOUNT
  • TRADE NOW
  • VISIT OUR BLOG
May 26, 2021North_American_Stocks_esIC Markets

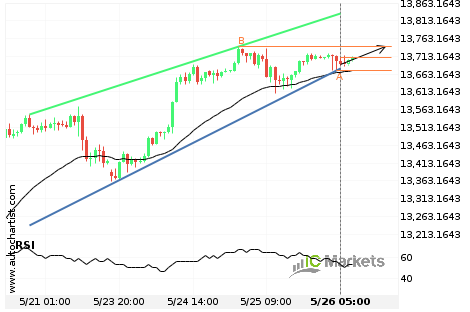
¿Tendrá el US Tech 100 Index suficiente impulso como para irrumpir la resistencia?

El US Tech 100 Index se dirige hacia la línea de resistencia de un Cuña ascendente y puede alcanzar este punto en las próximas 22 horas. Ha probado esta línea ya en numerosas ocasiones en el pasado, y esta vez no tendría porqué ser diferente y terminar con una recuperación en lugar de una irrupción. […]

Read more
May 25, 2021North_American_Stocks_esIC Markets

La línea de resistencia ha sido irrumpida por el US SPX 500 Index

El US SPX 500 Index ha atravesado la línea de resistencia, que ya se ha probado dos veces en el pasado. Hemos visto, anteriormente, un retroceso de esta posición, así que debemos esperar la confirmación de la irrupción antes de operar. Si esta nueva tendencia persiste, se puede esperar una línea objetivo de alrededor de […]

Read more
May 24, 2021North_American_Stocks_esIC Markets

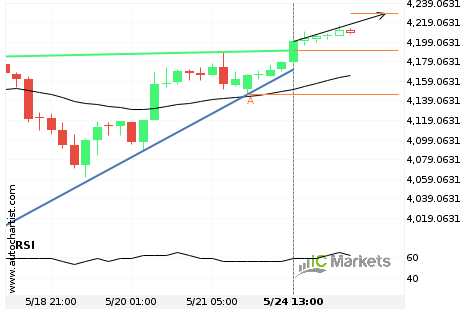
¿Tendrá el US Small Cap 2000 Index suficiente impulso como para irrumpir la resistencia?

El US Small Cap 2000 Index se dirige hacia la línea de resistencia de un Triángulo y puede alcanzar este punto en las próximas 2 días. Ha probado esta línea ya en numerosas ocasiones en el pasado, y esta vez no tendría porqué ser diferente y terminar con una recuperación en lugar de una irrupción. […]

Read more
May 21, 2021North_American_Stocks_esIC Markets

El US SPX 500 Index se acerca a la importante línea de precio de 4178.5000

El US SPX 500 Index se está acercando a la línea de resistencia de un Resistencia. Ha entrado en contacto con esta línea por lo menos dos veces en 5 días. Si prueba esta línea de nuevo, lo hará en las próximas 23 horas.

Read more
May 20, 2021North_American_Stocks_esIC Markets

¿Tendrá el US Tech 100 Index suficiente impulso como para irrumpir el soporte?

El US Tech 100 Index se dirige hacia la línea de soporte de un Canal bajista y puede alcanzar este punto en las próximas 16 horas. Ha probado esta línea ya en numerosas ocasiones en el pasado, y esta vez no tendría porqué ser diferente y terminar con una recuperación en lugar de una irrupción. […]

Read more
May 19, 2021North_American_Stocks_esIC Markets

El US Wall Street 30 Index está en dirección down

El US Wall Street 30 Index ha experimentado un excepcional movimiento descendente de un 0,51% de 34.431,8 a 34.281,2 en 8 horas.

Read more
May 18, 2021North_American_Stocks_esIC Markets

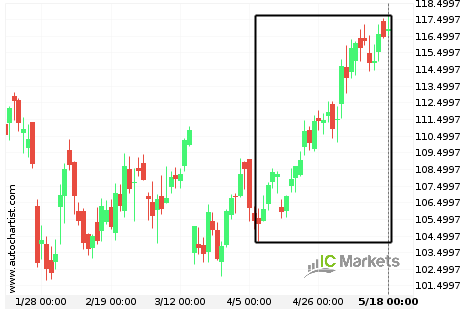
¿Hacia dónde se dirige el AbbVie?

Un movimiento de un 11,1% en 42 días de AbbVie no pasa desapercibido. Puede empezar a considerar hacía donde se dirigirá ahora: si seguirá con la tendencia ascendente actual o volverá a la dirección anterior.

Read more
May 17, 2021North_American_Stocks_esIC Markets

Inminente irrupción de una importante línea de precio del US Small Cap 2000 Index

El US Small Cap 2000 Index avanza hacia la línea de 2281.1001, que ya ha probado en numerosas ocasiones durante el pasado. Hemos observado un retroceso desde esta posición en el pasado, por lo que en esta fase no está claro si atravesará este precio o se recuperará como ya hizo antes. Si el US […]

Read more
May 14, 2021North_American_Stocks_esIC Markets

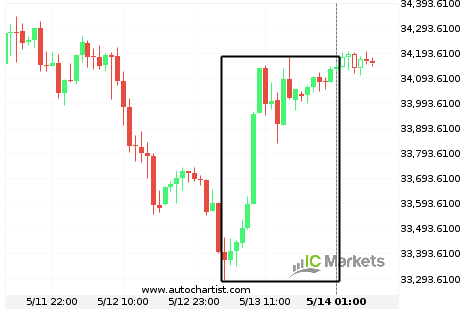
Extraordinario movimiento alcista del US Wall Street 30 Index

El US Wall Street 30 Index ha ascendido un 2,3% de 33.399,7 a 34.135,4 en 21 horas.

Read more
May 13, 2021North_American_Stocks_esIC Markets

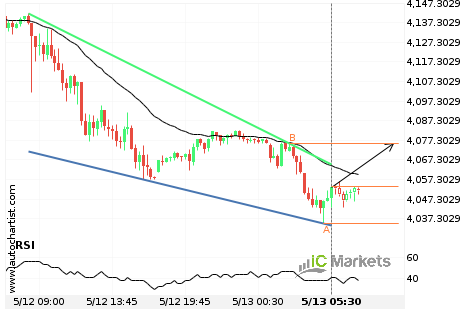
El US SPX 500 Index se aproxima a la resistencia de un Cuña descendente

El US SPX 500 Index se está acercando a la línea de resistencia de un Cuña descendente. Ha llegado a esta línea en numerosas ocasiones durante los últimos 21 horas. Si vuelve a probarla de nuevo, debería hacerlo en las próximas 5 horas.

Read more
  • 1
  • 2
  • 3
  • …
  • 82
  • 83
  • 84
  • 85
  • 86
  • 87
  • 88
  • 89
  • 90
  • 91

Recent Posts

  • Either a rebound or a breakout imminent on SILVER
  • GOLD Nível visado: 2976.3601
  • A potential bearish movement on GOLD
  • มีโอกาสเกิดการเคลื่อนตัวแบบ bearish บน GOLD
  • Posible gran movimiento en el AUDJPY

Recent Comments

    Translation


     Edit Translation

    Trade with

    a market leader you can rely on

    Open Trading Account Try a Free Demo

    Forex Trading

    • Accounts Overview
    • Open an Account
    • Launch Web Trader

    Trading Specifications

    • Spreads and Commissions
    • Range of Market
    • Trading Hours
    • Funding
    • Withdrawal

    About IC Markets

    • Help Center
    • Why IC Markets
    • Regulation
    • Legal Documents
    • Contact Us


    Forex Trading

    • Accounts Overview
    • Open an Account
    • Launch Web Trader

    Trading Specifications

    • Spreads and Commissions
    • Range of Market
    • Trading Hours
    • Funding
    • Withdrawal

    About IC Markets

    • Chat with a Specialist 24/7
    • Why IC Markets
    • Regulation
    • Legal Documents
    • Contact Us

    Disclaimer: This material is marketing material where all marketing material is published for informational purposes only. This material does not contain and should not be considered as containing - investment advice and recommendations, or suggestions for performing any actions with financial instruments. The built-in widgets belong to their external independent authors, and IC Markets is not responsible for their content and their impact on trade.

    All content rights reserved. Opinions of the authors may not coincide with the opinion of the blog editors. When copying materials from this site or connecting to an RSS feed to republish our articles, a link to IC Markets or attribution in the format ‘IC Markets Blog’ is required. For general questions, please contact the editorial office via the form on the Contact us page.

    Risk Warning: Trading Derivatives carries a high level of risk to your capital and you should only trade with money you can afford to lose. Trading Derivatives may not be suitable for all investors, so please ensure that you fully understand the risks involved and seek independent advice if necessary. A Product Disclosure Statement (PDS) should be considered before entering into a transaction with us.

    The contents of this page are general information only and does not take into account your personal situation, financial objectives or needs. It is up to you to make sure the products that we offer suit your specific needs. You should not trade with us unless you understand the features and risks of the products that we offer. This means that you might need to seek independent advice before you start trading with us.

    © 2022 Raw Trading Ltd | All rights reserved.
    • Sample Page